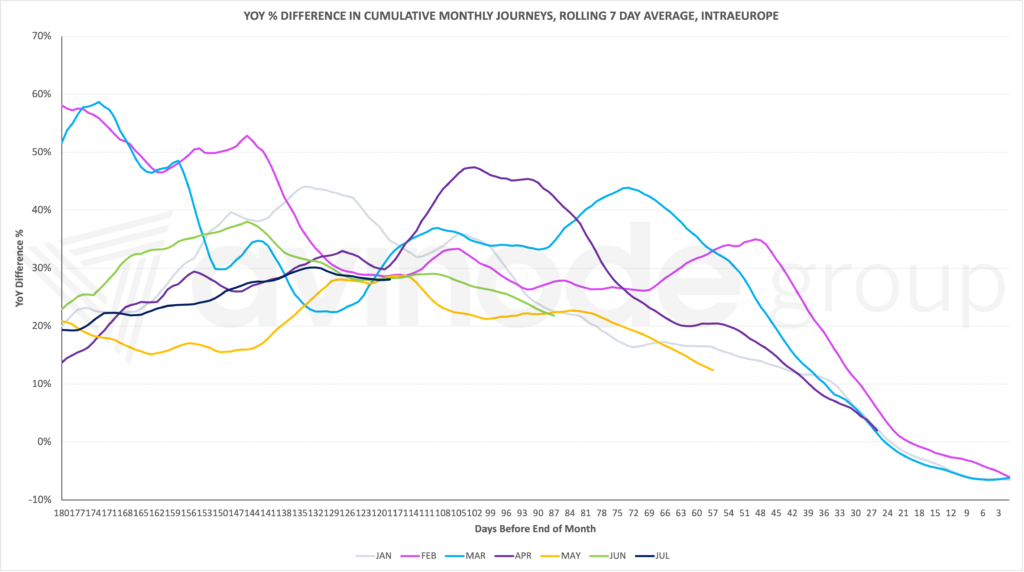
Within Europe, we observed charter demand for March this year finish 6% down compared to 2022 – the same year-over-year decrease as we saw for January and February. So far April is showing a similar trend – I expect it to finish around 6% down as well.
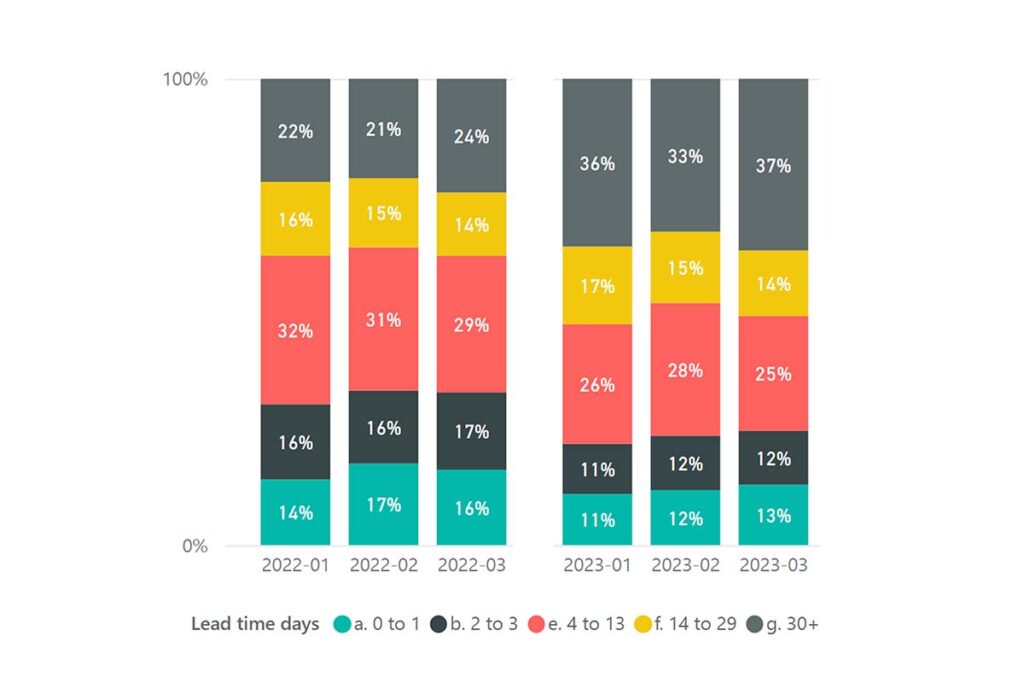
These months have all reflected a common pattern, that early booking has been higher than last year. People have been able to plan further in advance, meaning there has been proportionally less last-minute demand.
The above column chart shows that the requests sent by European companies in Jan-Mar 2023 has longer lead times than in 2022.
The summer peak is coming in Europe
May is slightly different. Whilst demand for the month has so far totaled 12% above 2022’s levels, we see fewer early bookings compared to 2022 than previous months. The rate of decrease in year-over-year performance is lower too. May is always a month when we see European seasonality ramp up, and 2022 was even more so. How May performs should offer good indications for the rest of the summer.
Our best estimate is that May will end with a similar decrease versus 2022, but it could surprise us.

US demand levels decreasing
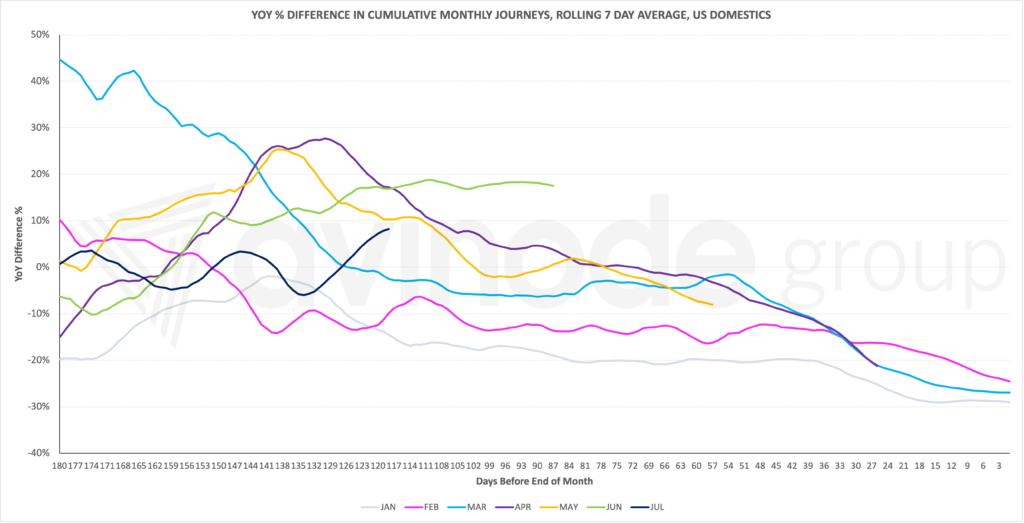
Within the United States, the year-over-year declines are greater. Avinode usage was huge in winter 2021-2022, and the peak we saw was even larger than the actual increase in charter flights due to the challenges to find available lift.
This year, March ended 27% down versus 2022, and April and May are showing similar trends. This is driven by an actual decrease in charter demand compared to the very high levels in 2022, together with the increasing supply in Avinode this year.
Whilst still early to be making predictions, the summer months look different. This is driven by the fact that sourcing issues had started to relent by June 2022 and demand started its return to more normal levels. That’s why we expect June and July 2023 to show more modest declines versus 2022.

How to read the line charts:
The coloured lines each represent a month. The vertical axis is the year-over-year percentage difference in the number of journeys being sourced through Avinode.
The horizontal axis is the days before the end of the month, stretching from 180 days to 0. By following each line, you can see how demand is building for the month. This gives us early indications of how each month will perform.
